Graphs
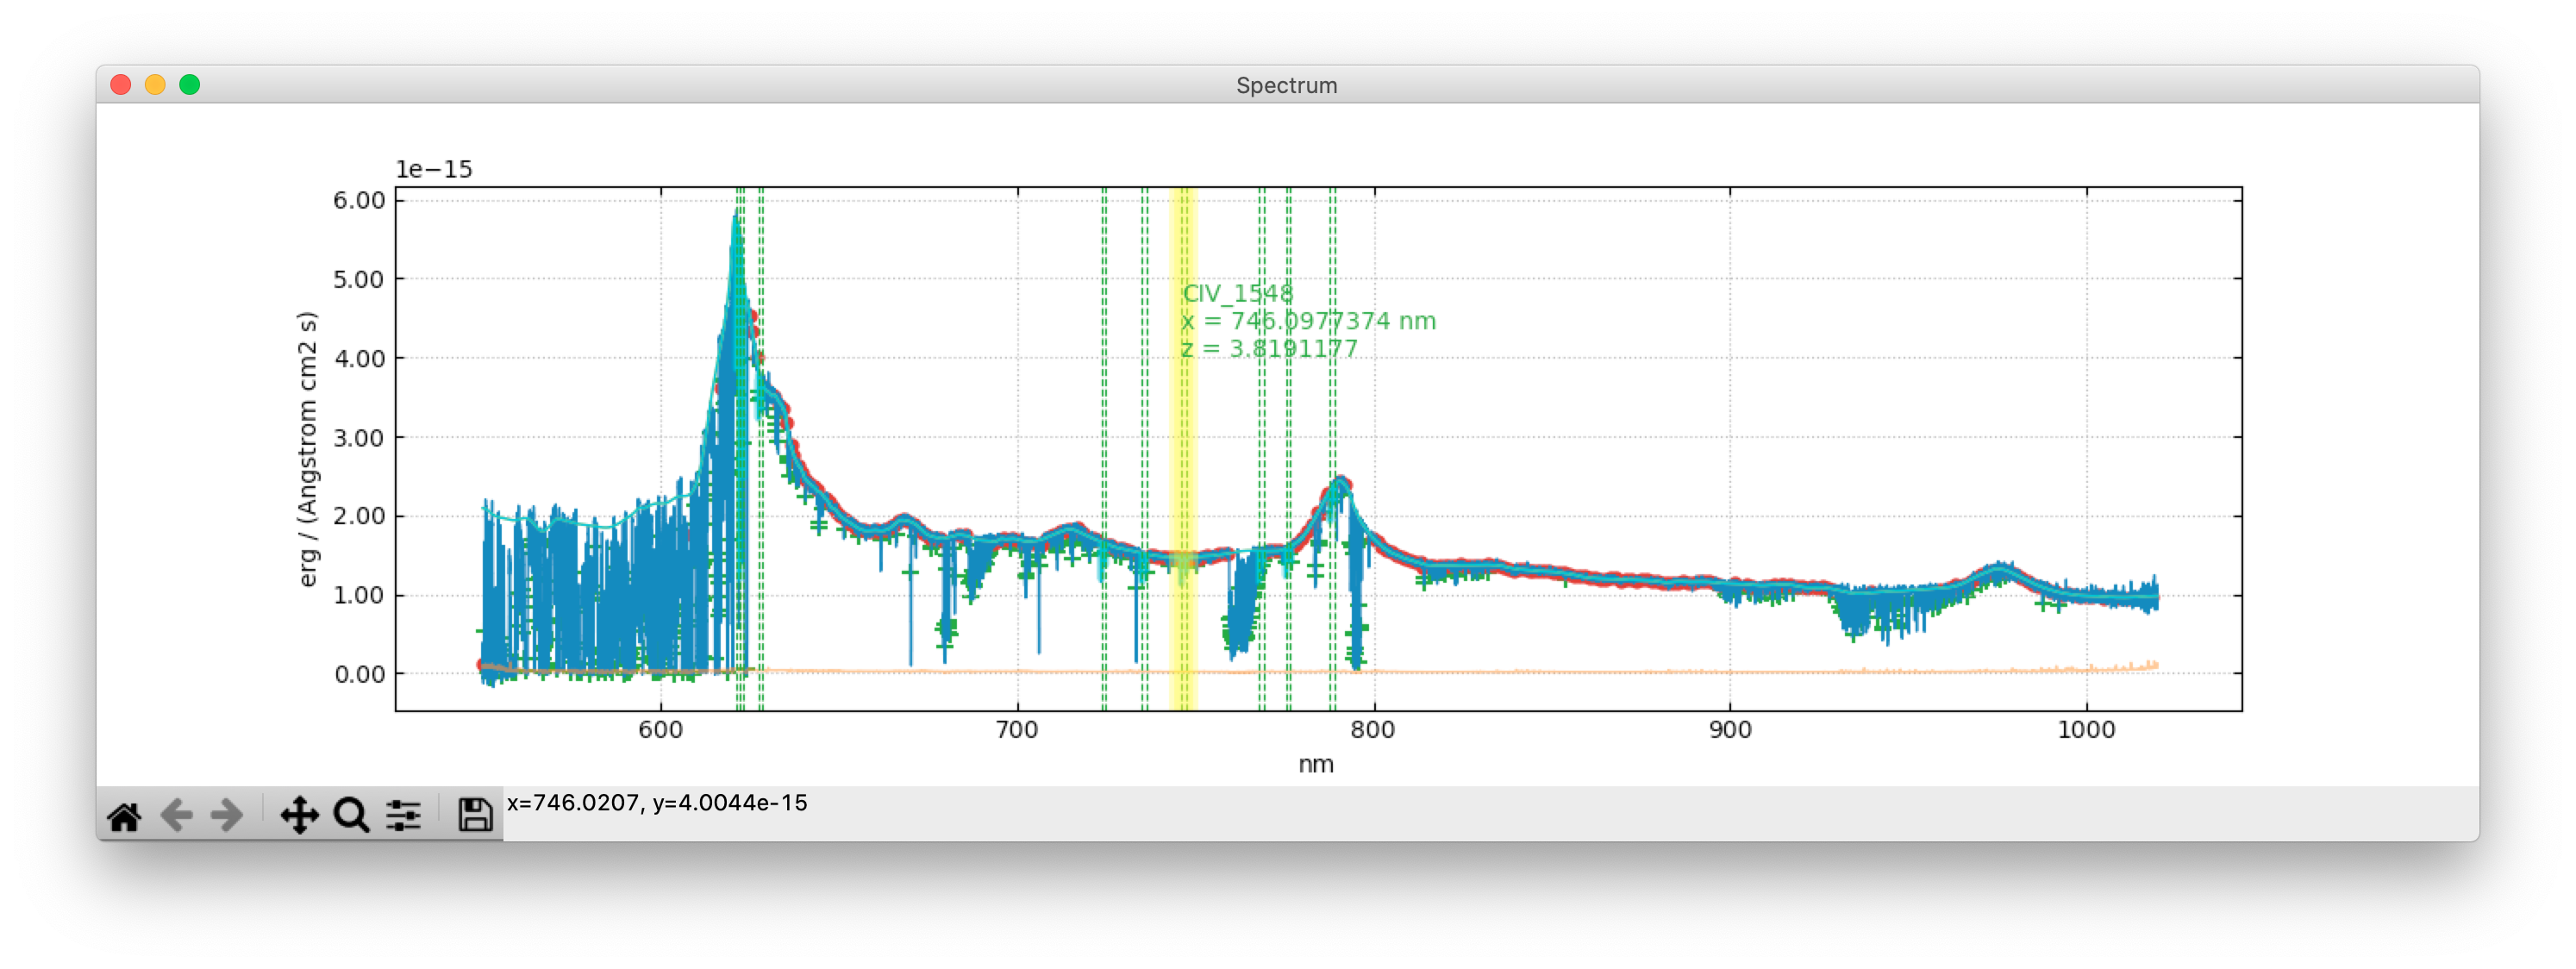
Graphs are the main way to inspect and interact with the data within Astrocook. A main plot window is shown whenever a session is loaded, while a detail plot will appear when a system is selected in the system table. The plots are handled by matplotlib and equipped with a navigation toolbar to zoom in and out, pan, adjust, and save the image.
Table of contents
Main graph
This is an example of main graph with default elements displayed: